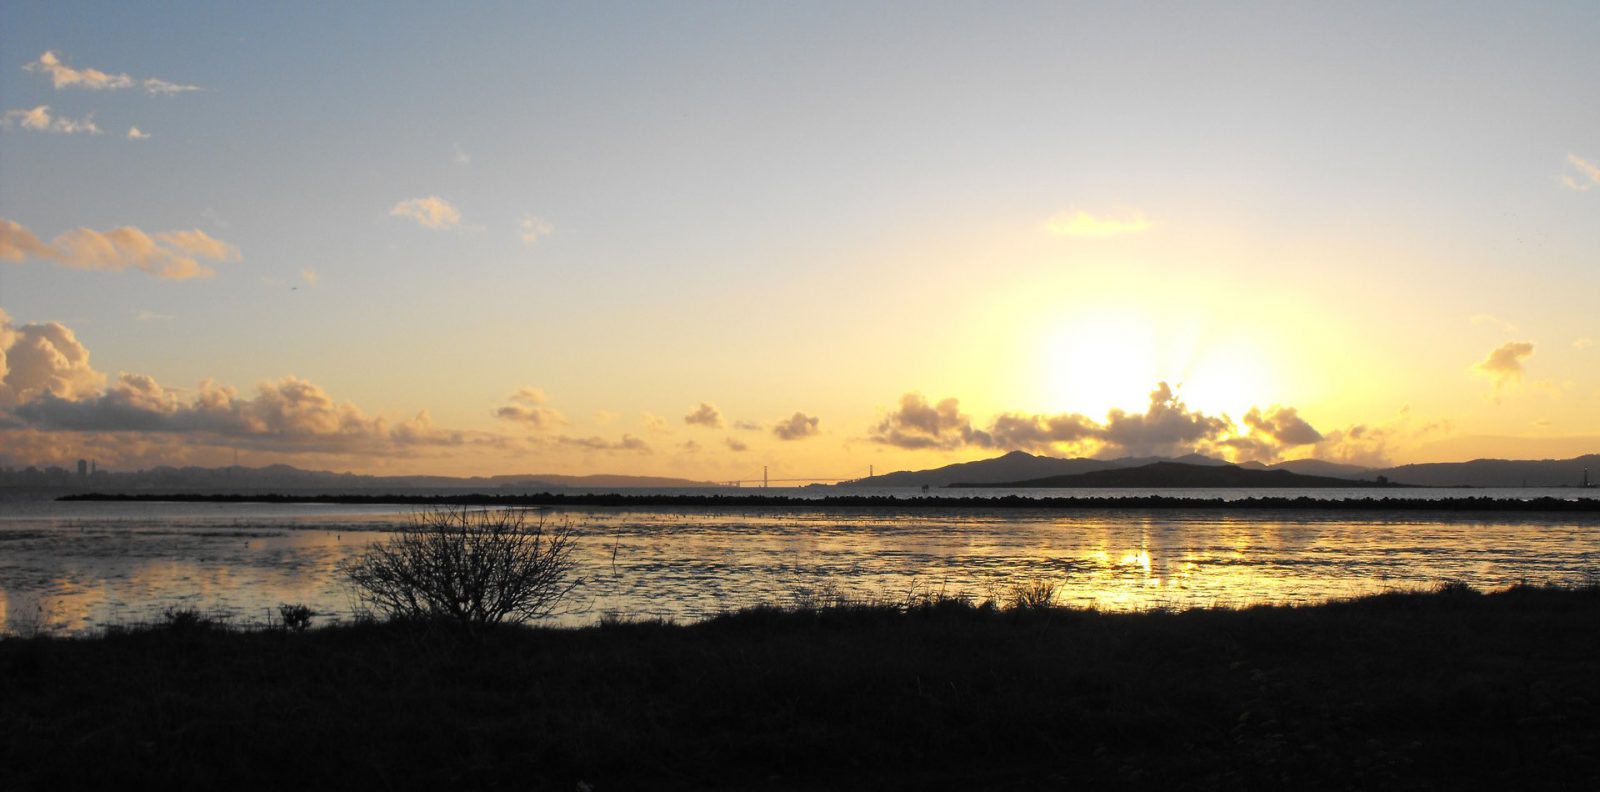


San Francisco Bay is the largest estuary in California, with a watershed that drains 40 percent of the state’s freshwater runoff. Over the past 200 years, like much of the country’s estuarine environments, the Bay’s watershed has been extensively altered by large-scale development associated with agriculture and urbanization, resulting in floodplain and wetland loss, and inflows have been redirected and reduced.
This type of development and modification can have significant effects on estuarine systems. Stormwater runoff and wastewater discharges deposit elevated levels of nutrients, including nitrogen and phosphorus, which have the potential to contribute to harmful algal blooms (HABs) and deplete levels of dissolved oxygen (DO), which can kill fish and cause the loss of important habitats like seagrass meadows. This sequence of events is a process known as eutrophication.
However, unlike many estuaries in other parts of the United States, such as the Chesapeake Bay in Maryland and Virginia or Tampa Bay in Florida, San Francisco Bay did not exhibit clear signs of ecological impact from nutrient enrichment for most of the 20th century. That has been changing.
Historical Effects
During most of the 20th century, San Francisco Bay was able to accommodate increased nutrient loads without expressing the same eutrophication problems seen in other estuaries across the United States, such as Long Island Sound, NY, and Sarasota Bay, FL. This was due to a combination of factors: (1) San Francisco Bay historically had high turbidity—meaning lower water clarity from the significant amounts of light-blocking suspended sediments loaded into the Bay, (2) strong tidal mixing reduced the amount of time pollutants persisted in the Bay, and (3) cooler waters limited the growth rates and/or growing season of phytoplankton and HABs. All of these factors reduced the growth rates and biomass levels of the Bay’s phytoplankton populations, by different interacting mechanisms.
A Changing Estuary
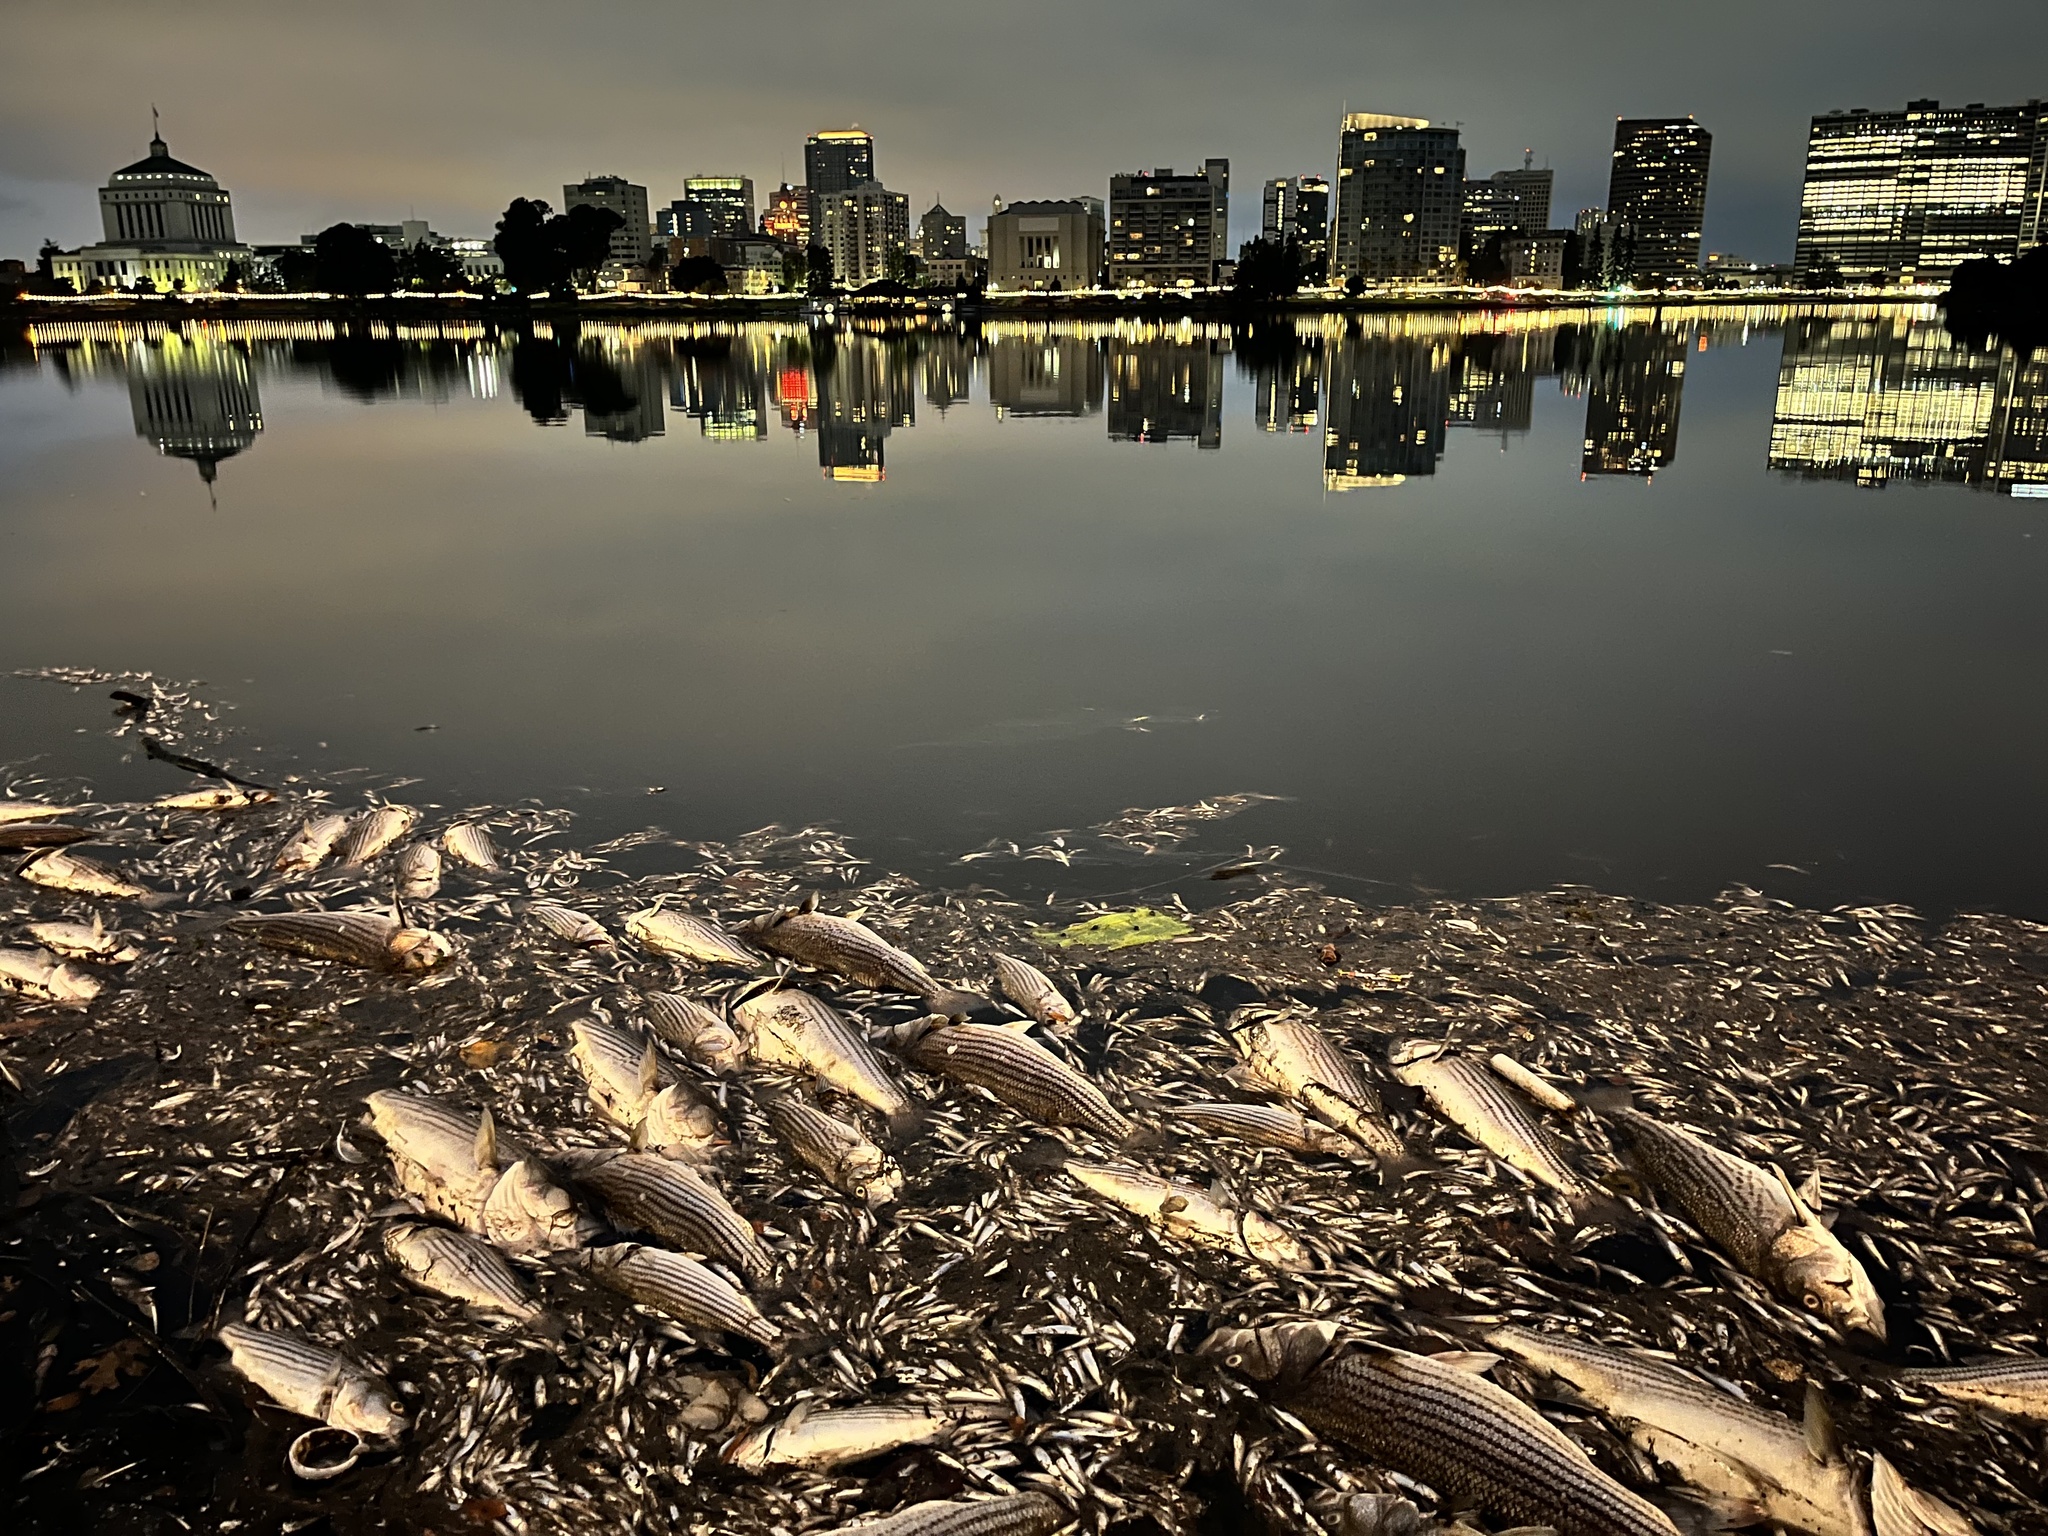
Unfortunately, over the past 20 or so years, the factors that have provided a buffer from nutrient-loading impacts in the San Francisco Bay have been weakened. This is likely due to a combination of climate change (which has warmed the waters of the Bay) and other factors, and San Francisco Bay has become more susceptible to increased nutrient loads, resulting in HABs, low DO levels, and fish mortality events. Since 1999, as recorded by the San Francisco Estuary Institute (SFEI), there has been a notable uptick in algal bloom events, leading to the creation of the San Francisco Bay Nutrient Management Strategy (NMS).
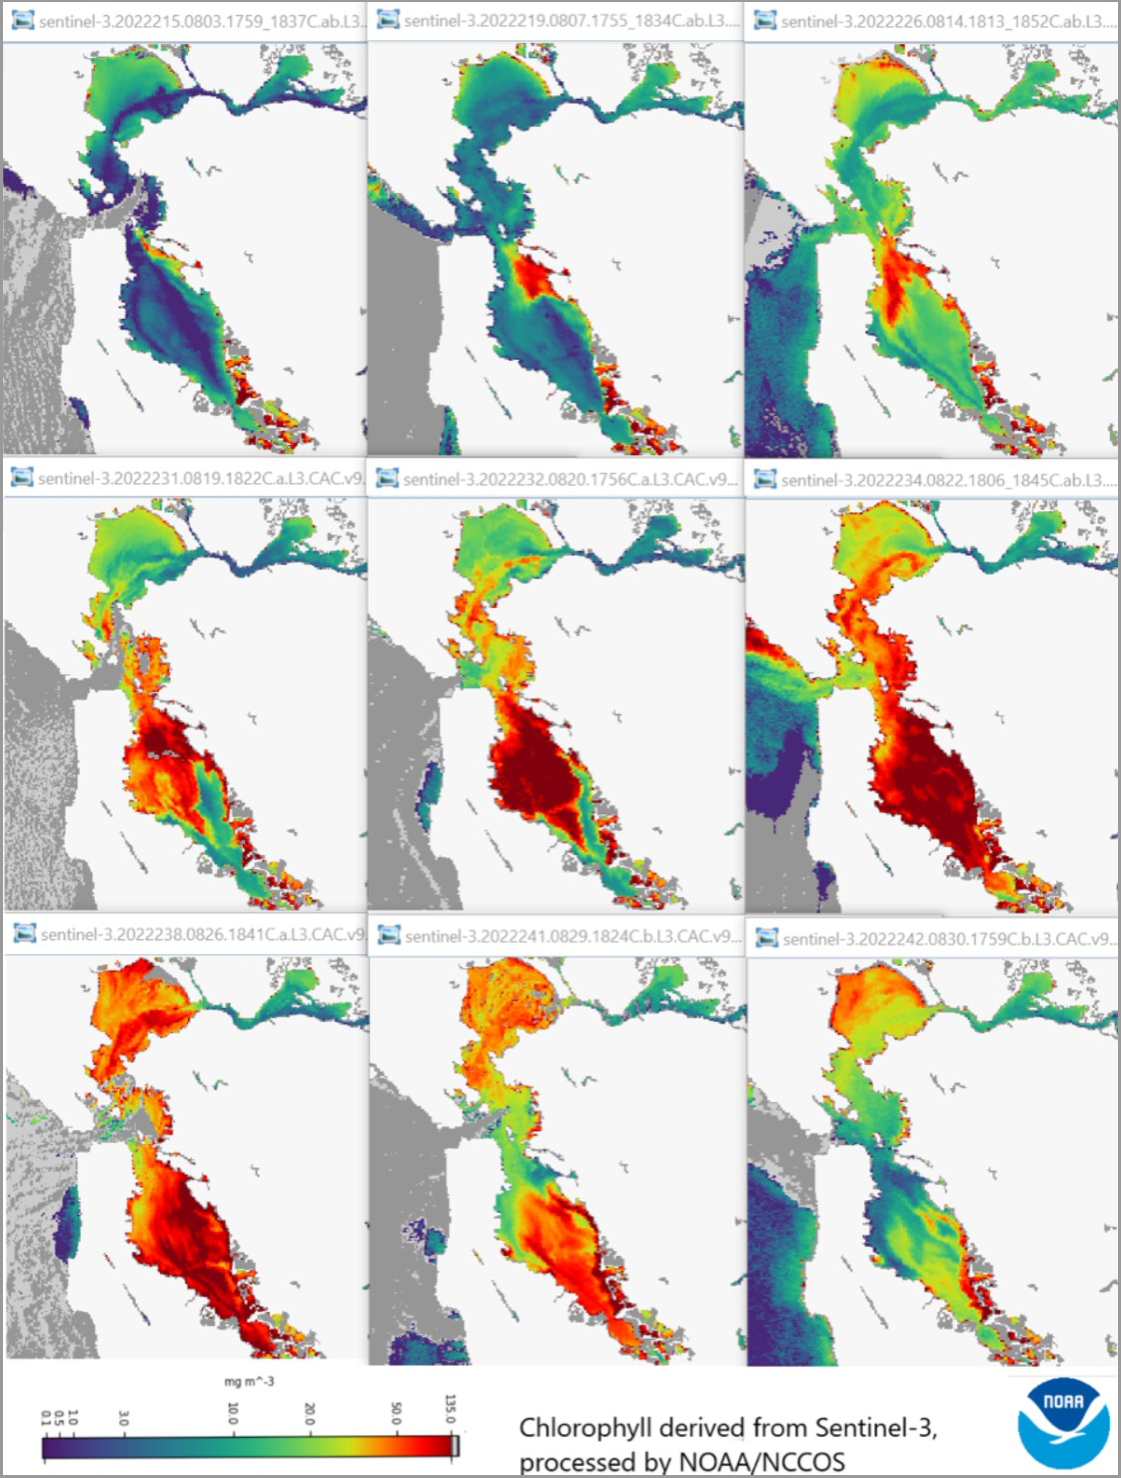
High levels of nitrogen concentrations within waterbodies are directly related to levels in wastewater discharges,1 and during the dry season, municipal wastewater discharges account for more than 80 percent of the inorganic nitrogen loads to San Francisco Bay.
As these discharges are obvious and controllable nutrient sources, state and federal agencies, guided by reports from the NMS and other programs, have a timely need to address common causes.
In 2024, the Regional Water Quality Control Board – San Francisco Bay Region (SFBRWQCB) set forth requirements to reduce Bay-wide loads of total inorganic nitrogen from area wastewater treatment plants by 40 percent, compared to 2022 levels2.
Currently, resource managers in the San Francisco Bay region now face similar challenges as those confronted by managers in Florida, New York, Connecticut, and Rhode Island did several decades ago.
National Efforts Can Point to Common Causes and Solutions
While the issue of nutrient loads from wastewater treatment plants is a fairly new one for San Francisco Bay to consider, these impacts have been acted upon in other locations for several decades.
In the 1970s and 1980s, Florida’s Grizzle-Figg Act, which implemented higher water quality standards for wastewater treatment plants, was instrumental to reducing nitrogen loads to Tampa Bay and Sarasota Bay, by as much as 50 to 70 percent.
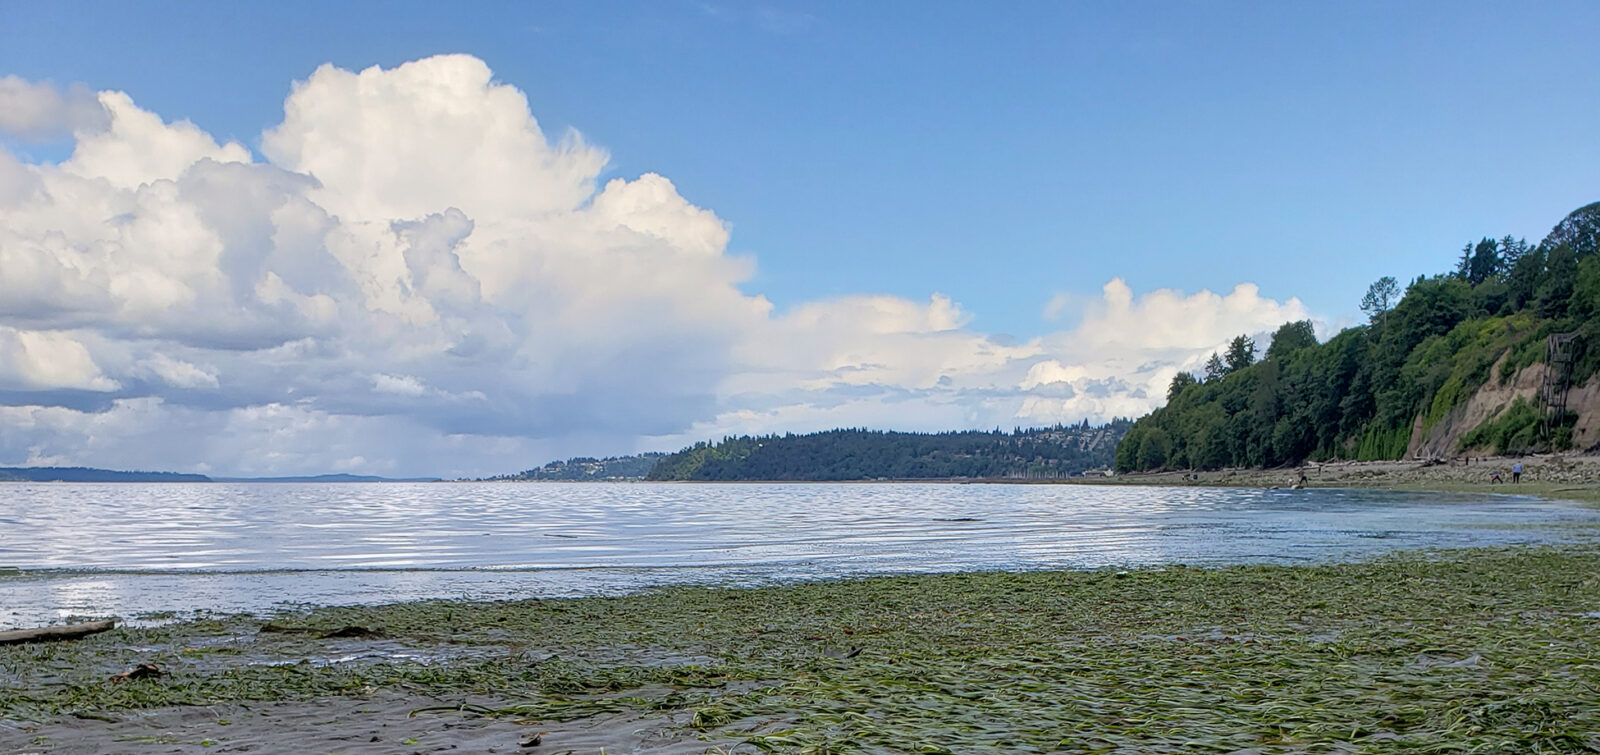
Upon implementing those load reductions, water quality in both Tampa Bay and Sarasota Bay improved dramatically, resulting in decreased problematic DO levels, reduced algal blooms, improved water clarity, and increased seagrass coverage by more than 50 percent, compared to levels in the 1980s.
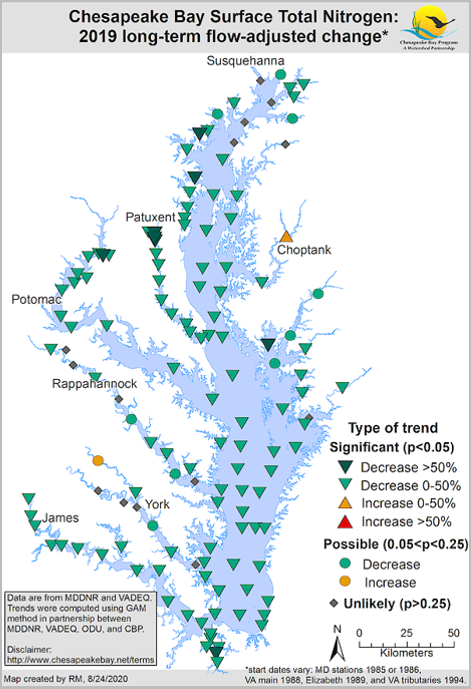
In Long Island Sound, a key component that helped local governments meet their regulatory targets was the implementation of nitrogen abatement strategies, which brought about a 64 percent reduction from wastewater discharges. In response, the extent of low DO bottom waters in Long Island Sound decreased by more than 100 square miles.
In Rhode Island’s Narragansett Bay, modifications to wastewater treatment plants—a source estimated to contribute 60 to 70 percent of the inorganic nitrogen loads to the Bay—were identified as the most cost-effective solution to improve that system’s ecological stresses. In response, water quality in Narragansett Bay increased substantially over the past few decades.
Looking to Case Studies
Over the next several years, as wastewater facilities implement the SFBRWQCB’s nutrient reduction plan for the Bay, it is possible that San Francisco Bay will experience similar ecosystem-scale benefits as those documented in Tampa Bay, Sarasota Bay, Long Island Sound, and Narragansett Bay. And it is possible that some of the “lessons learned” from those systems could be helpful for resource managers in the San Francisco Bay region. These lessons include adjusting expectations for the amount of time it takes to see positive system responses following load reductions, as well as the synergistic responses to planned nutrient management activities.
Linked pollutant load and water quality response models developed for San Francisco Bay are also useful tools for local resource managers as they consider abatement measures. However, managers should refer to the actual recorded responses of complex estuarine systems from prior load reduction strategies, which can help to identify issues that might not be fully considered in model simulations.
For example, in Tampa Bay, nitrogen loads from bottom sediments in the most polluted parts of the Bay—a result of decades of nutrient loading from wastewater treatment plants—were thought to have brought about a three-year time lag between the onset of load reductions and the initial reduction in phytoplankton levels.
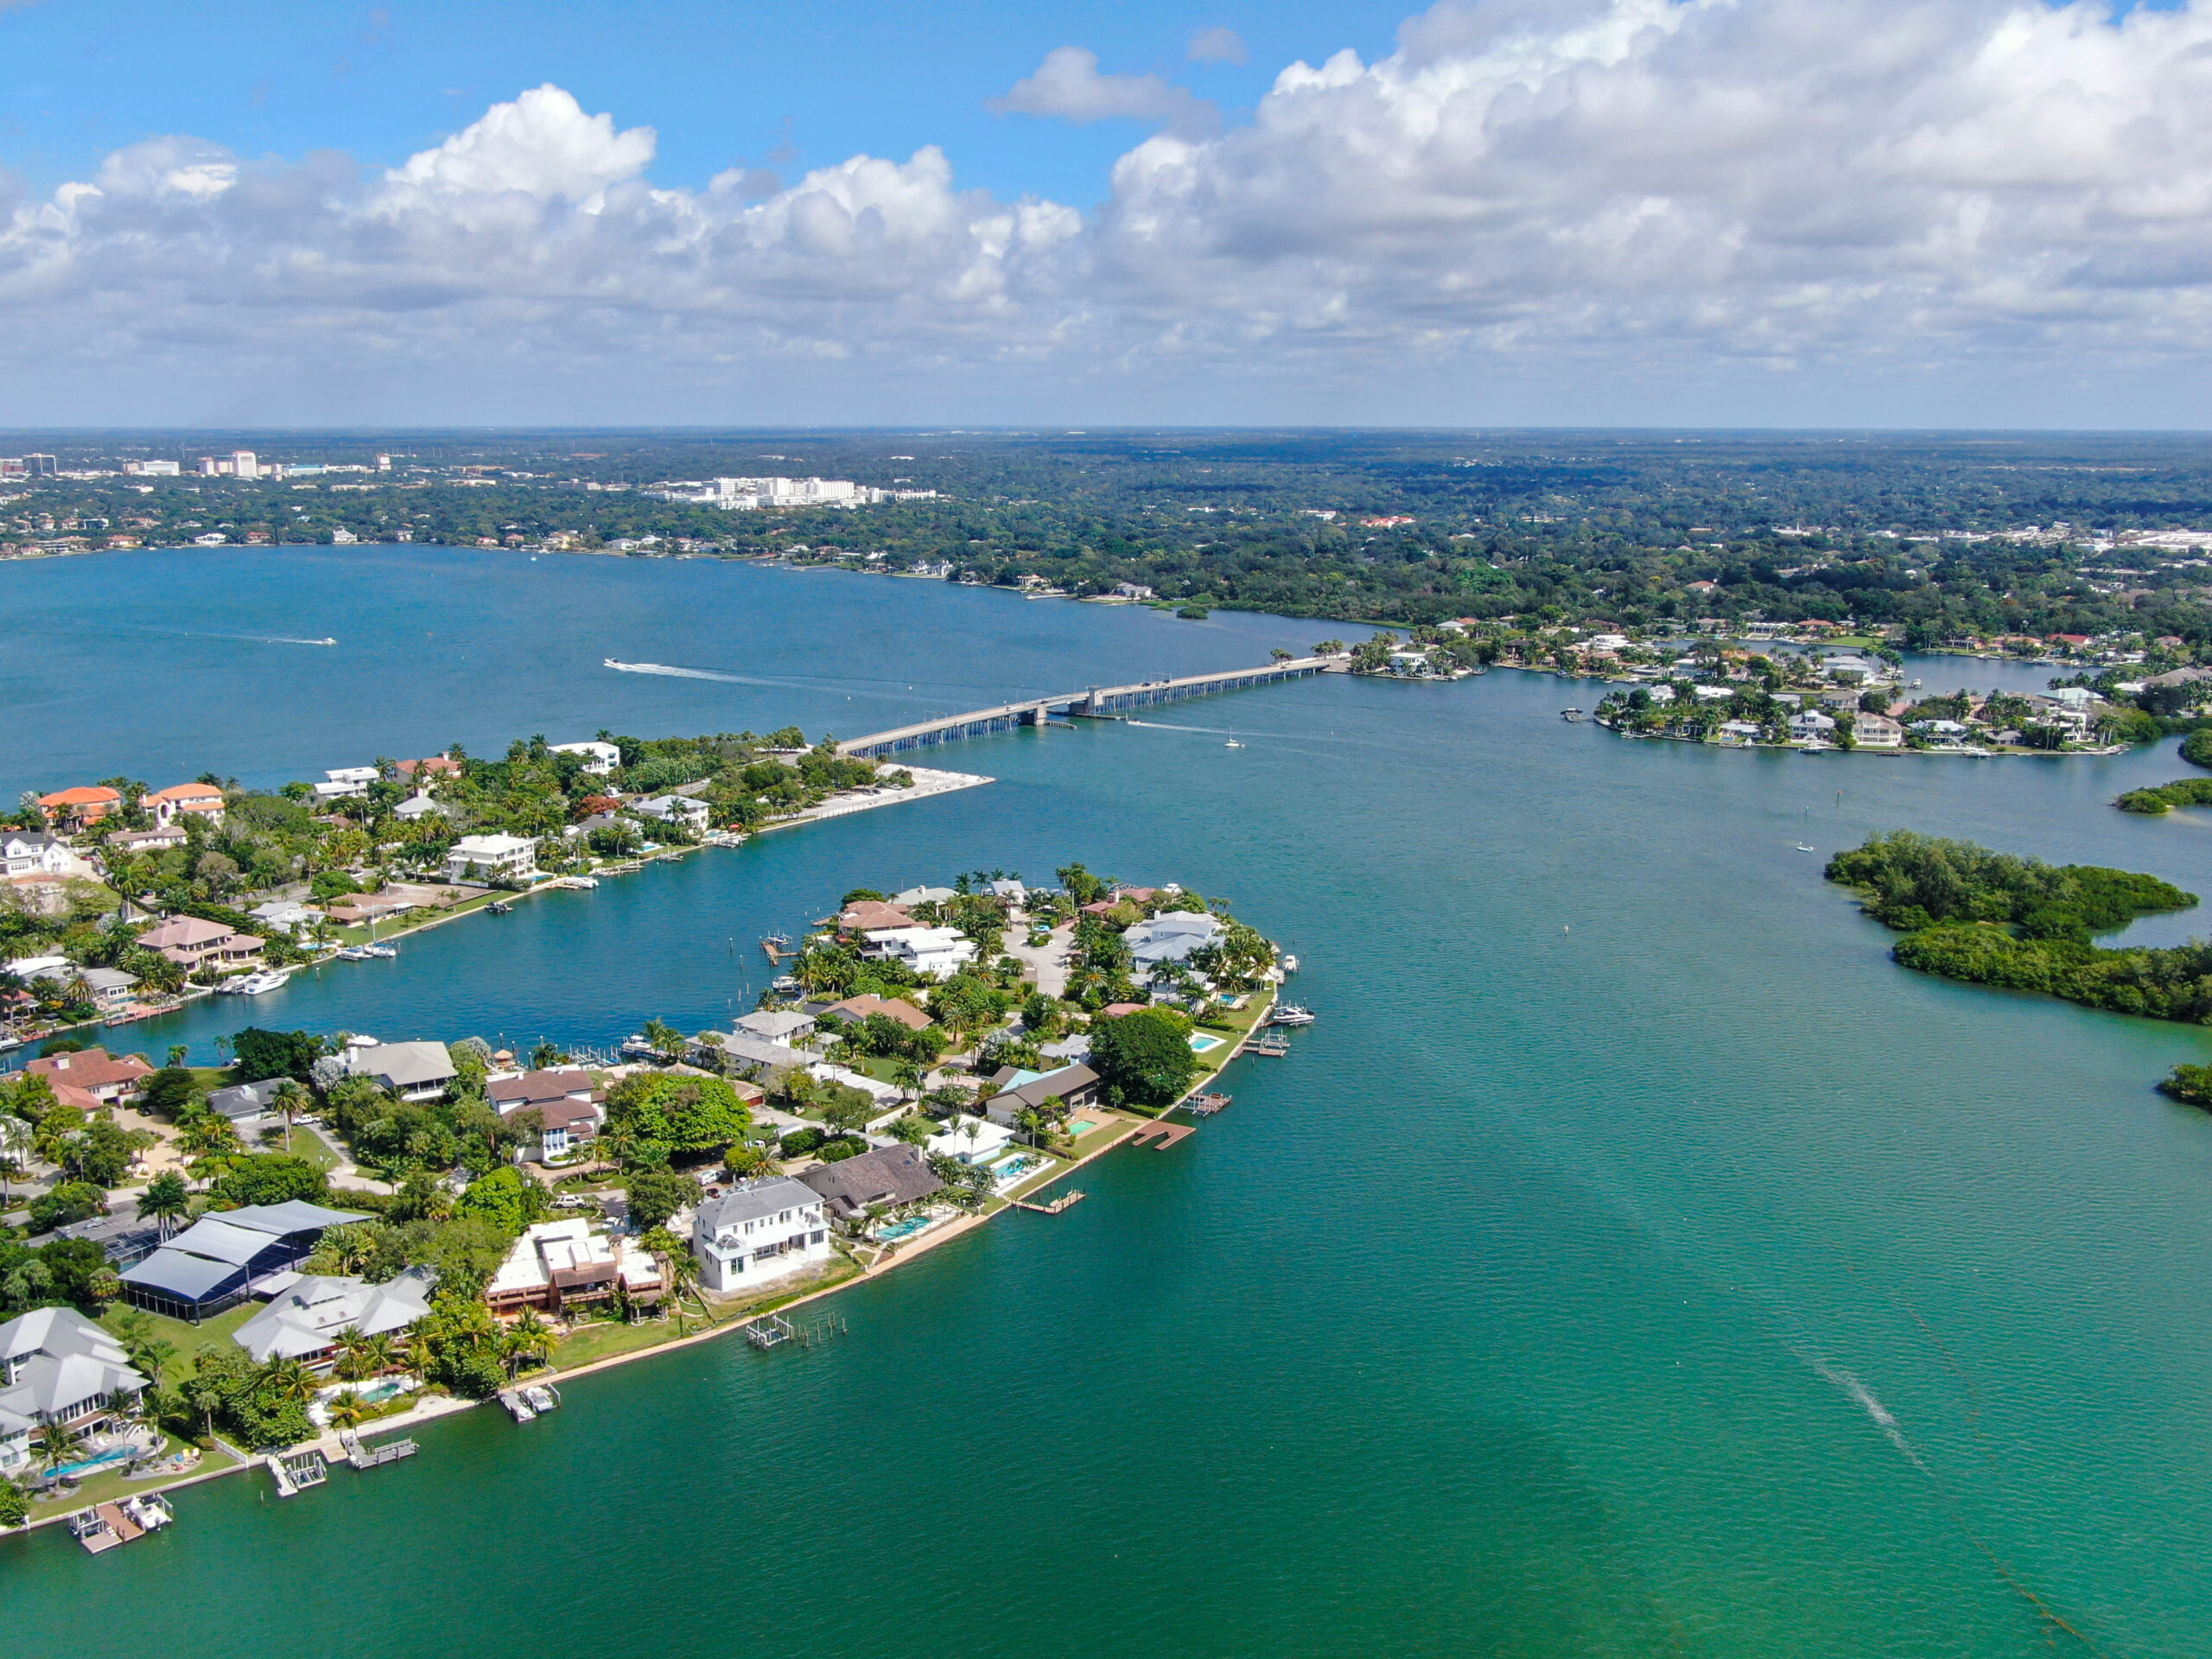
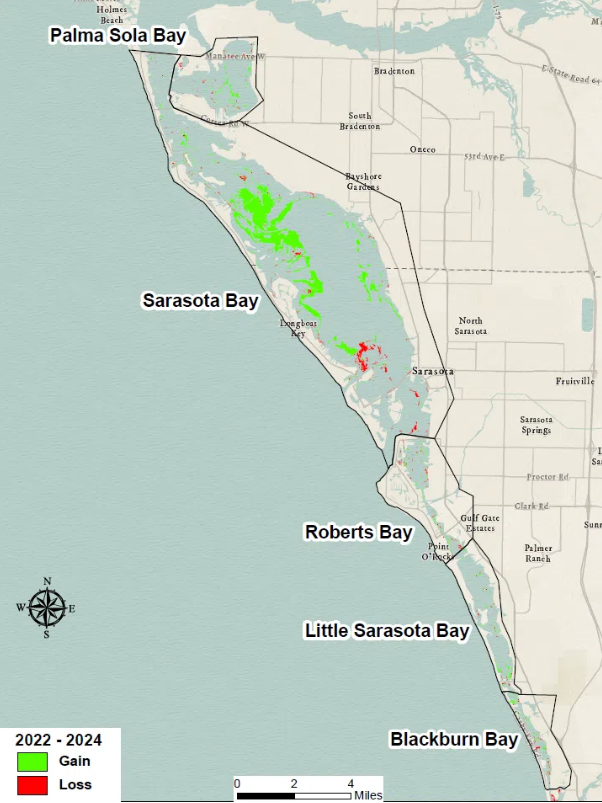
From 2022 to 2024, Sarasota Bay increased seagrass coverage by 19 percent, sufficient to provide habitat for about 70 million fish.
In Sarasota Bay, the biggest system response to both increased and recent decreased nitrogen loads was via macroalgae, large seaweeds, which were not included in Sarasota Bay’s original water quality management criteria. After recent nitrogen reductions were implemented, seagrass recovered by 19 percent in Sarasota Bay, but those increases took several years. In Long Island Sound, the greatest improvements in DO levels occurred in areas that did not directly correspond with the largest pollutant load reductions. In Narragansett Bay, some community members have complained that the bay is now “too clean” as the reduced phytoplankton levels have perhaps led to a decrease in the number of filter feeding clams, although this is debatable.
In addition, techniques have varied substantially and depended on local circumstances. While the SFBRWQCB permit highlights the use of “nature-based solutions,” such as horizontal levees, many of the wastewater treatment plants in other regions have not had the capacity to build such systems. In some locations, nutrient reduction strategies have focused on engineered solutions to promote a linked nitrification-denitrification treatment process within the footprint of existing facilities. In some of the newest nitrogen-removing wastewater treatment plants, the use of membrane bioreactor systems has substantially reduced the costs of nitrogen removal, while simultaneously decreasing the total nitrogen concentrations well below Florida’s Grizzle-Figg standards.
Next Steps
Community members and resource managers could benefit by considering the scientific basis that informed these water quality measures across the Northeast and Southeast, and the types of system responses and potential timescales they may see in the San Francisco Bay following nitrogen load reductions. Additionally, engineers, scientists, and project managers who have designed, permitted, constructed, and are overseeing nitrogen reduction strategies throughout the United States could also provide strategic insights to local utilities in the region, to help them consider new cost-effective methods and innovative approaches.
ESA’s water quality and aquatic scientists are experts in monitoring and examining environmental impacts to water systems, and they bring the technical expertise and practical knowledge necessary to develop monitoring plans and solutions to the San Francisco Bay. For more information, please contact Dave Tomasko and Chris Fitzer.
1 The high percentage of nitrogen load associated with wastewater discharges is related to the relatively high concentration of nitrogen in those discharges, with an average Total Nitrogen (TN) concentration of 20.5 mg / L estimated by the SFBWQCB (Order R2-2024-0013, NPDES Permit C0038873).
2 In contrast, Florida’s Grizzle-Figg Act (FS 403.086), which was passed in the late 1970s, does not allow surface discharges of wastewater effluent into the coastal waters of Central and Southwest Florida unless the annual average TN value in effluent is below 3 mg/L.
Author

Watershed and Water Quality Director
Date
September 3, 2026