Since the beginning of the interstate highway system in the late 1950s, transportation facilities were...

Climate Change Data Visualization
The user-friendly visualizations and interactive tools created for this initiative support ongoing project work by Seattle City Light staff, scientists, and decision-makers in addressing climate change in western Washington.
Why does this project matter?
These tools distill complex climate modeling and scenarios into accessible formats easily understood by technical staff and other stakeholders, allowing meaningful decision-making in order to respond and adapt to local climate change impacts.
What is ESA doing to help?
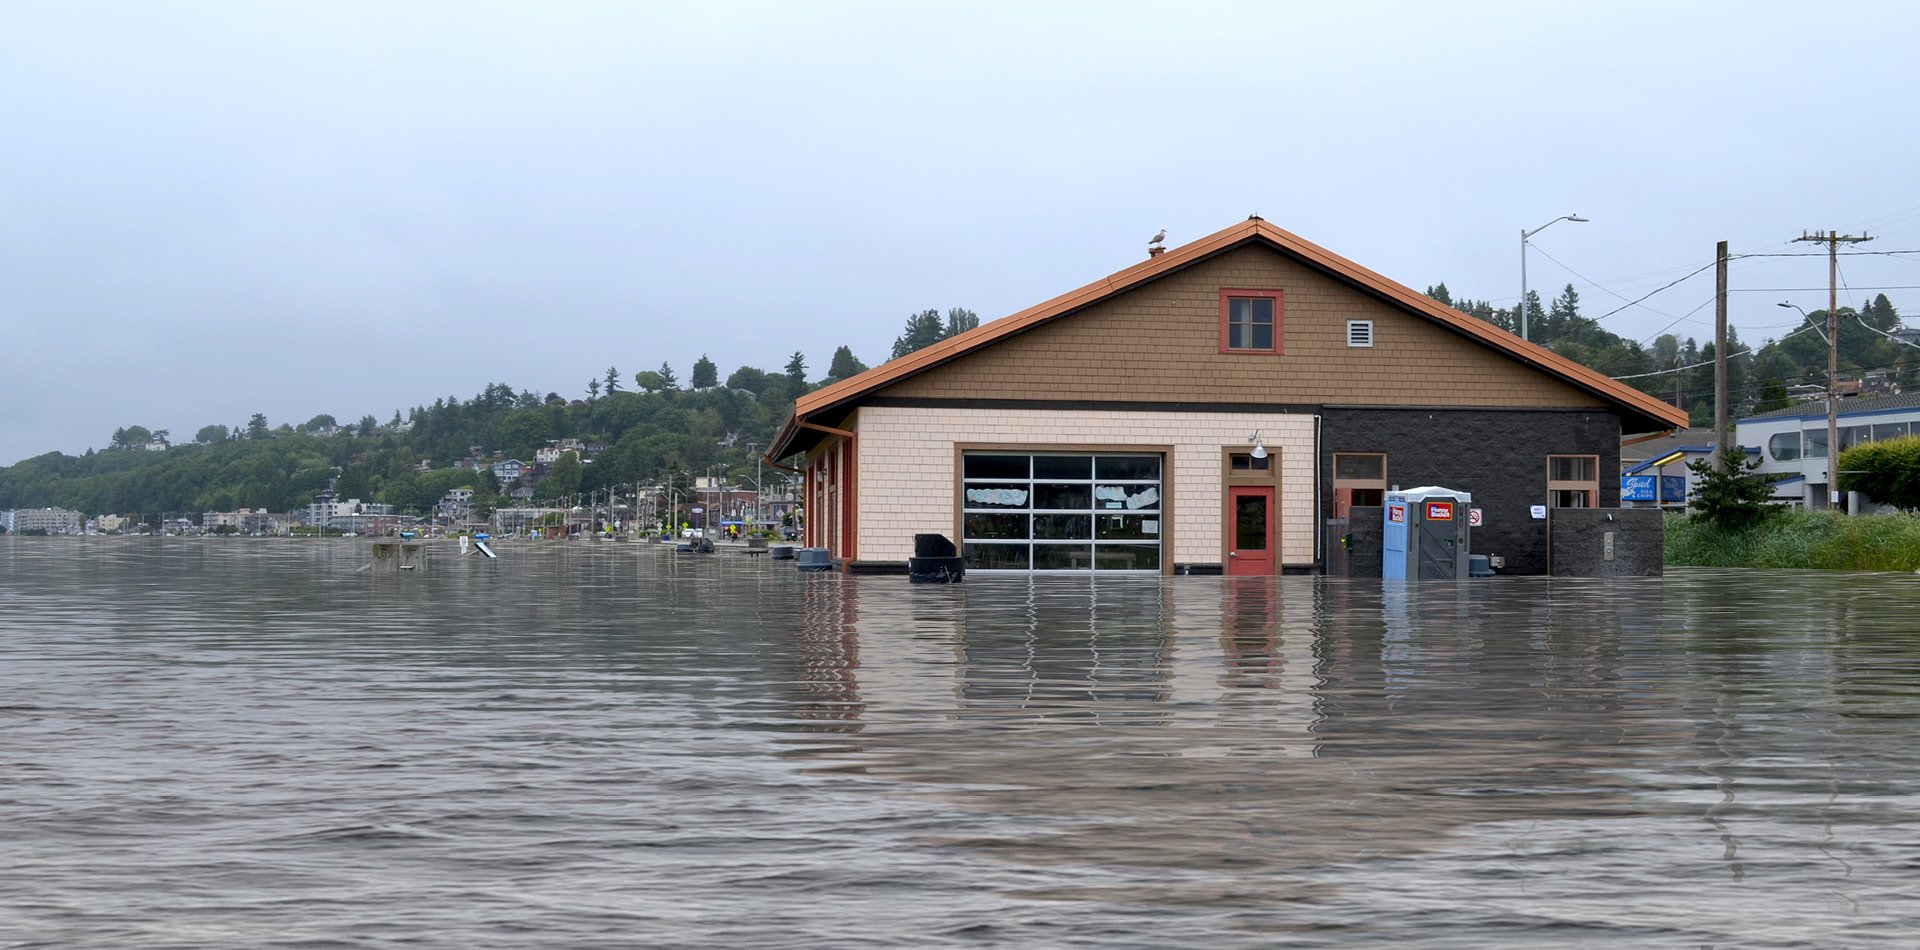
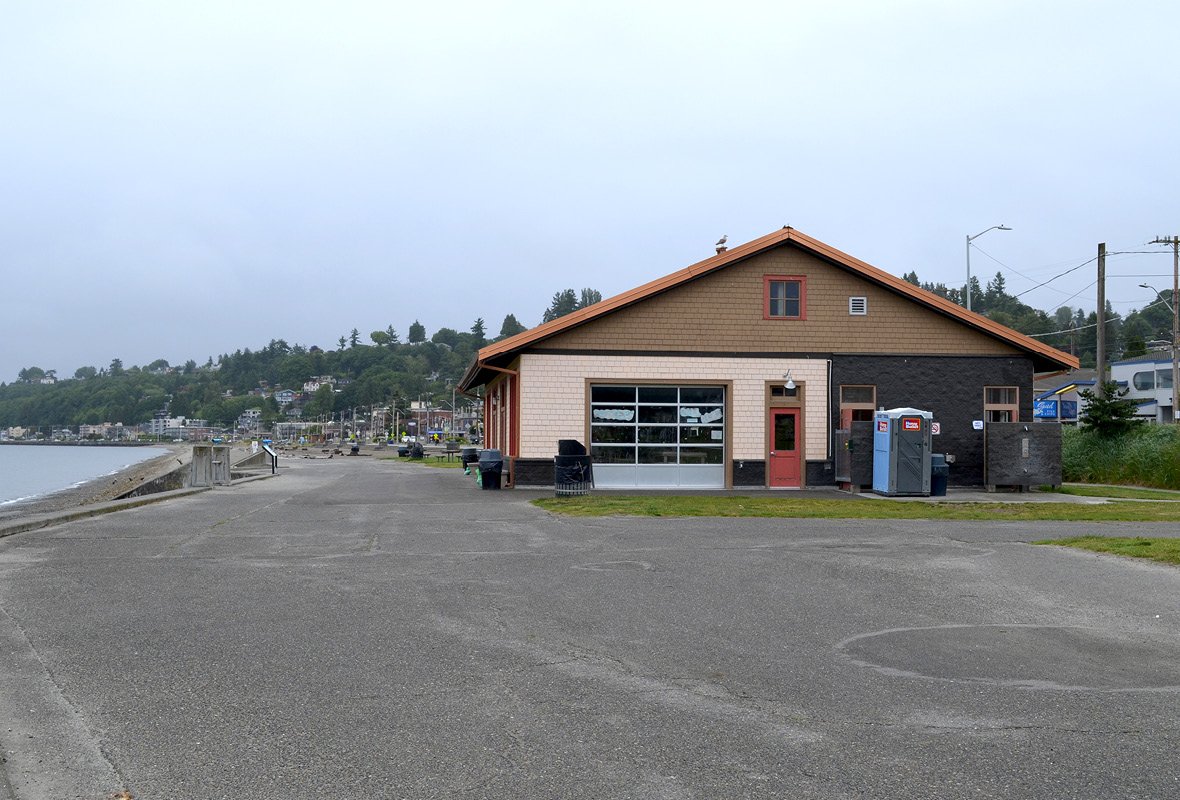
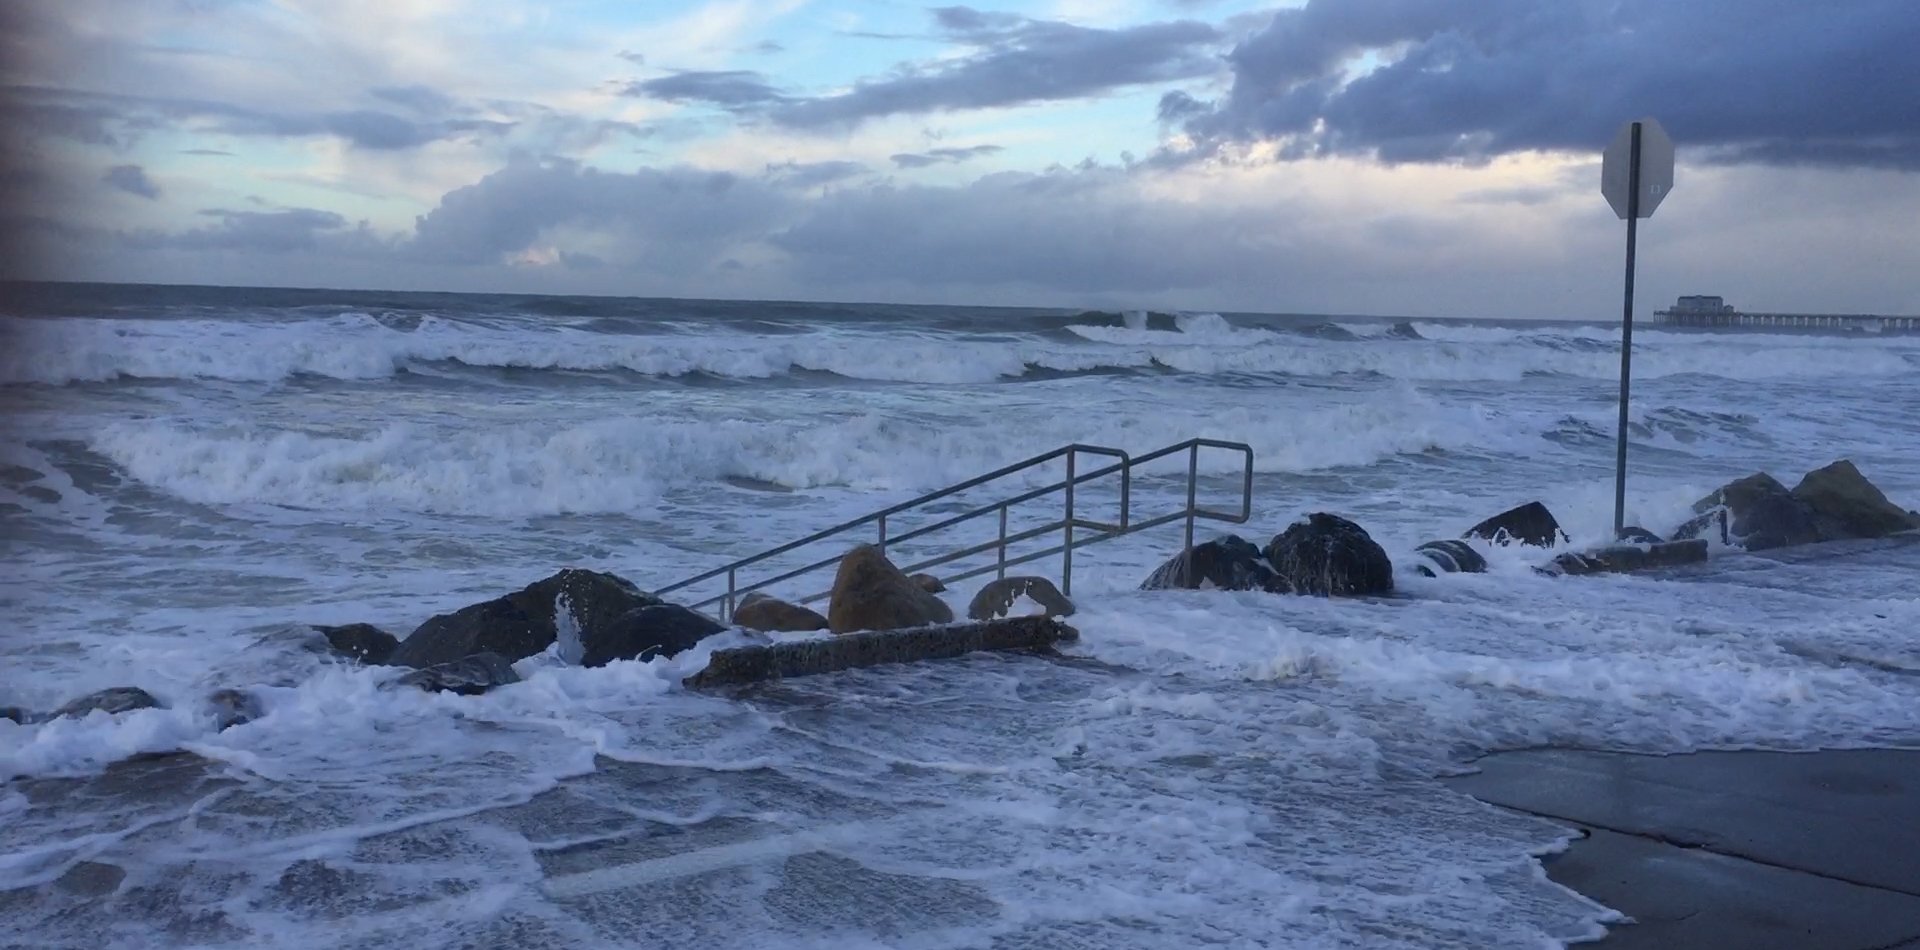
ESA developed these resources based on recent climate modeling studies of low flow and peak flow data in the Skagit River, temperature monitoring in western Washington, and sea-level rise projections near Seattle City Light facilities. Photo simulations, interactive dashboard charting tools, and a custom web application provide current and future temperature and precipitation projections.
Future phases of the project will add features and functions to the custom-authenticated web application tools.
Connect with our team

Similar Projects
News & Ideas
Climate Adaptation Plans (CAPs) provide actionable steps for local jurisdictions to reduce emissions and streamline...
Following the Sacramento Kings' move to their new stadium at Golden 1 Center, the 183...
California’s Senate Bill 379 requires cities and counties to incorporate climate adaptation and resiliency strategies...
Our design team has restored many projects, but the dramatic transformation of the Calistoga Elementary...
Join us in welcoming Tamseel Mir as Community Development Business Group Director for ESA's Southern...